All content here is for research and educational purposes only, not financial advice.
![]()
Studying the EURUSD
While intraday trends and monthly seasonality information on the EURUSD is widely available, it is worthwhile to understand the data better to see if there are intrinsic patterns that can be distilled for further studies to develop a trading strategy.
In this article, we study the intraday trends of the EURUSD and compare it across the different trading days of the week to spot volatility regimes and daily seasonlity patterns.
EURUSD Background
EURUSD indicates the amount of USD required to purchase one EUR. The EURUSD is the most traded currency pair globally, and has high liquidity, which enables tighter spreads as well as market depth. It first started trading in Jan 1999, when the EUR was introduced as the common currency for several European countries.
Preparing the Dataset
The 1-min EURUSD prices data across the range of 2024-2025 was obtained from Massive.
The dataset is cleaned for duplicates and made to be time zone-aware, specifically with UTC time zone. It is also observed that there are missing data in the magnitudes of ~3-10 each day, which is taken as omitted data due to low liquidity. After cleaning up, we have a total of 369,833 minutes and 364,053 minutes worth of data for 2024 and 2025 respectively that will be used for analysis.
Analysis of EURUSD in 2025
Distribution of Daily EURUSD Returns (2025)
We start the research with understanding the distribution of EURUSD log returns across different days of the week.
Figure 1: Spread of Log Returns by Day (2025)
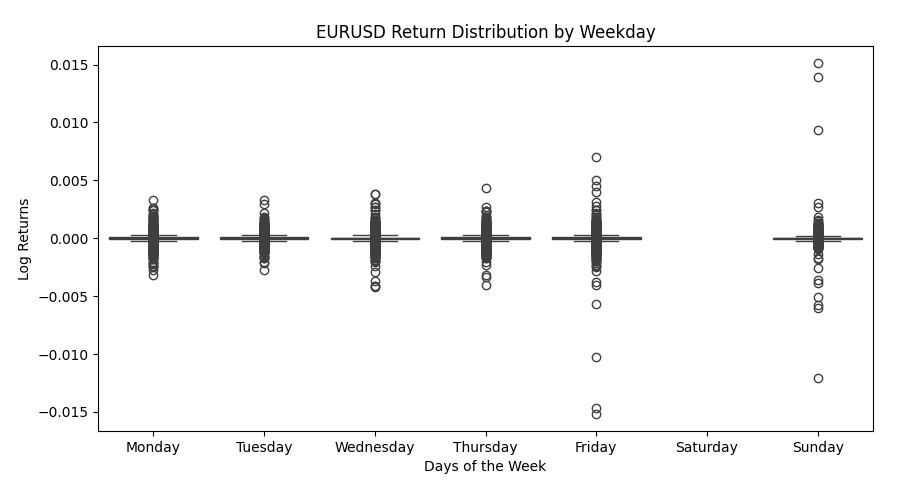
Table 1: Summary Statistics of EURUSD Log Returns by Days of the Week (2025)
| Weekday | n | Mean | Median | Std | Skew | Kurtosis |
|---|---|---|---|---|---|---|
| Monday | 73,251 | 6.20e-07 | 0.0 | 0.000145 | 0.012425 | 33.04 |
| Tuesday | 72,241 | 2.01e-07 | 0.0 | 0.000137 | 0.202521 | 21.42 |
| Wednesday | 73,201 | 2.95e-07 | 0.0 | 0.000154 | -0.252609 | 60.31 |
| Thursday | 73,141 | 4.12e-07 | 0.0 | 0.000149 | 0.005264 | 40.33 |
| Friday | 65,323 | -4.41e-07 | 0.0 | 0.000183 | -18.2796 | 1572.22 |
| Sunday | 6,895 | 6.58e-06 | 0.0 | 0.000373 | 12.9142 | 912.11 |
We can observe that the log returns are centred close to 0 on all days, meaning there is negligible unconditional return bias.
In particular, Sunday exhibits the highest volatility, with a standard deviation of 0.000373. The extreme outliers on Sundays are attributable to weekend opening price gaps, as information accumulated over the Saturday trading break are incorporated into prices at the market opening on Sundays.
We can also observe that Friday has the largest standard deviation relative to other weekdays. Additionally, it also has the largest kurtosis (1572) and pronounced negative skew (-18.28), indicating stubstantial downside tail risk. it is likely that institutional participants rebalance or reduce exposure ahead of the weekend, increasing the probability of large price adjustments.
We move on to look at the intraday log returns.
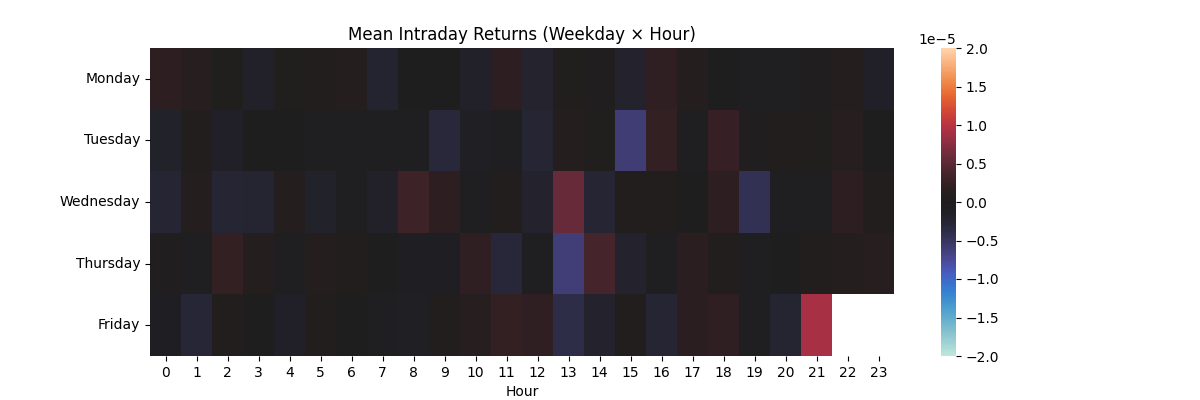
Figure 2: Intraday Log Returns (2025)
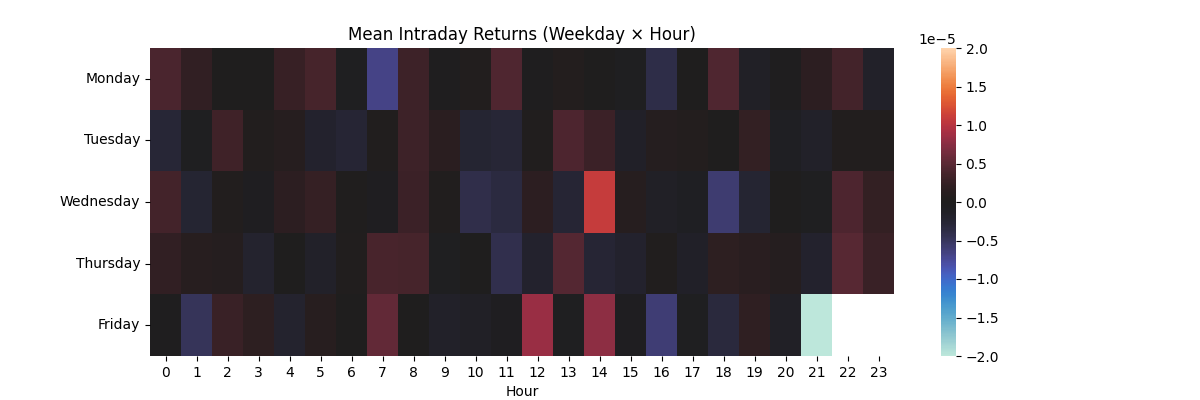
Mean intraday returns exhibit no visually strong or persistent directional pattern across days, with mean returns remaining close to 0 across most hourly buckets. However, modest positive deviations can be observed across the 1200hrs to 1400hrs time period, particularly during mid-week. This coincides with the London-New York market hours overlap. In contrast, 2100hrs on Friday exhibits a pronounced negative mean.
Intraday Volatility Analysis (2025)
Now that we’ve analysed the returns across days of the week and within the days, we move on to study volatility.
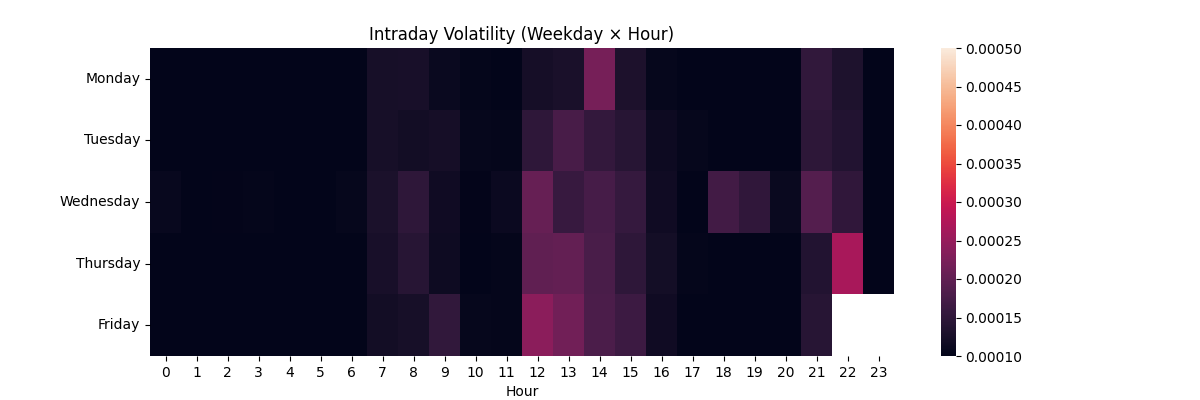
Figure 3: Intraday Volatility (2025)
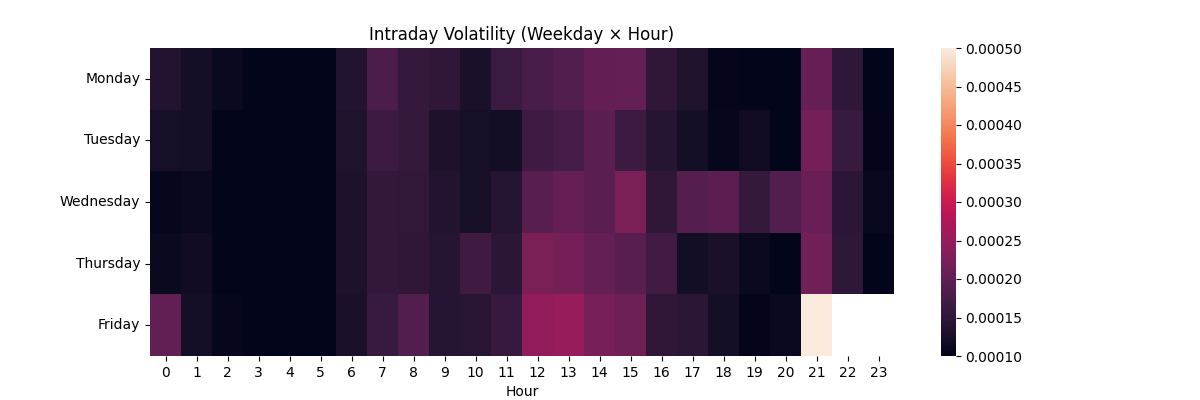
We can see that there are three regions of elevated volatility that largely tallies with ATFX’s reporting of intraday volatility behaviour:
- 0600hrs to 0900hrs, which coincides with the London open.
- 1200hrs to 1500hrs, which coincides with the London-New York session overlap. In particular, Wednesday exhibits persistent elevated volatility beyond this period up till 2100hrs.
- 2100hrs, particularly Fridays: likely reflecting end-of-day positioning effects, similarly for Friday with pre-weekend repositioning to reduce risk exposure.
Analysis of EURUSD in 2024
We derive the same plots for 2024 to investigate if there are trends similar to 2025.
Distribution of Daily EURUSD Returns (2024)
Figure 4: Spread of Log Returns by Day (2024)
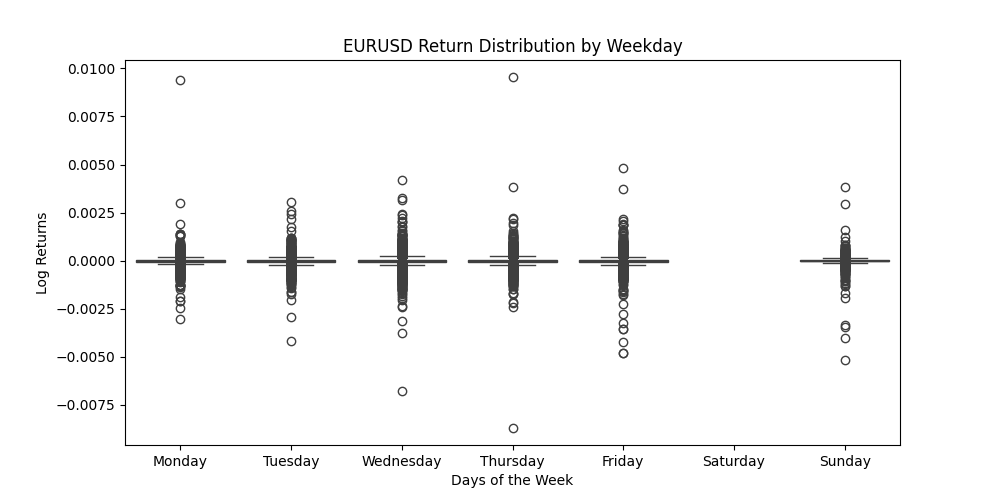
Table 2: Summary Statistics of EURUSD Log Returns by Days of the Week (2024)
| Weekday | n | Mean | Median | Std | Skew | Kurtosis | P05 | P95 |
|---|---|---|---|---|---|---|---|---|
| Monday | 74,164 | -6.20e-08 | 0.0 | 0.000112 | 7.55 | 704.53 | -0.000165 | 0.000165 |
| Tuesday | 75,407 | -4.23e-07 | 0.0 | 0.000112 | -0.50 | 60.96 | -0.000173 | 0.000170 |
| Wednesday | 73,392 | -1.81e-07 | 0.0 | 0.000132 | -1.54 | 154.20 | -0.000184 | 0.000183 |
| Thursday | 73,560 | 7.94e-09 | 0.0 | 0.000128 | 1.59 | 730.08 | -0.000180 | 0.000176 |
| Friday | 66,514 | -1.41e-07 | 0.0 | 0.000126 | -1.90 | 173.08 | -0.000175 | 0.000175 |
| Sunday | 6,795 | -8.54e-07 | 0.0 | 0.000159 | -7.90 | 365.93 | -0.000131 | 0.000131 |
Similar to 2025, the log returns are centred close to 0 on all days, and Sundays are also the most volatile, with a standard deviation of 0.000159. Excluding Fridays and Sundays, volatility is observed to be lower across the week in 2024. Despite this, the elevated kurtosis across most weekdays indicates that tail events were more violent in 2024.
Skewness in 2024 exhibited both larger magnitudes and more frequent sign reversals across the week. Whereas skewness in 2025 was largely concentrated on specific days, 2024 displayed pronounced positive and negative skew on multiple weekdays, indicating more unstable and pervasive tail asymmetry.
Figure 5: Intraday Log Returns (2024)
For intraday log returns, patterns are broadly similar across 2024 and 2025, with no clear or persistent directional trend observed. In both years, Fridays exhibit larger end-of-day movements in log returns, although the directions differ.
Intraday Volatility Analysis (2024)
Figure 6: Intraday Volatility (2024)
Intraday volatility in 2024 displays similar high-volatility regions to 2025, notably during 0600–0900 and 1200–1500. However, unlike 2025 where volatility peaks at 2100hrs on Fridays, 2024 shows elevated volatility at 2100hrs on Thursdays instead.
What Then for Trading EURUSD?
The clear lack of directional trend coupled with clearly defined high volatility regions indicate that there is limited scope for directional trading strategies. Instead, we should focus on volatility-based approaches and incorporate measures to mitigate convexity and tail risk. Of note though, the analysis was done only with 2024-2025 data and may present limitations given the lack of depth in data across time.
We will explore such approaches in the next part!
Citations
ATFX. ‘Best Time to Trade EURUSD - Optimal Trading Hours Explained’. ATFX Global - Official Website, 28 August 2024. https://www.atfx.com/en/analysis/trading-strategies/best-time-to-trade-eurusd.
PS: GenAI was used to support the writing of this piece - but mostly for equation writing, cleaning up of markdown formatting, and language!
Comments